
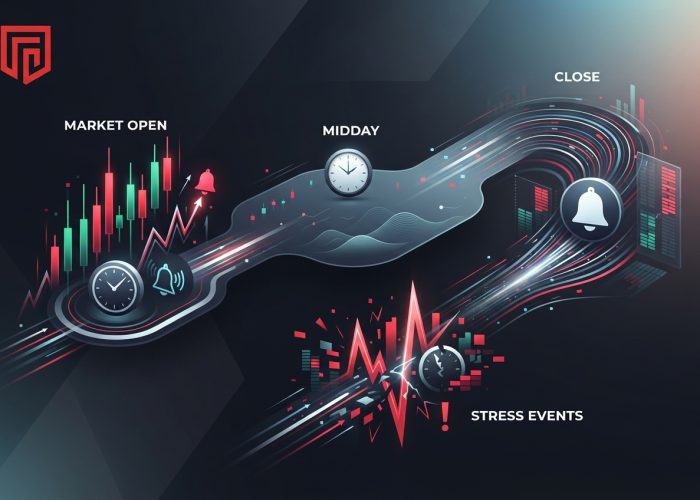
Liquidity rarely stays constant from one hour to the next because markets respond to who is present and what they need. The open brings overnight news into prices. Midday can be quiet, while closing benchmarks draw fresh orders. Unexpected news can overturn that rhythm within seconds. Each period changes the balance between trading demand and available orders.
Yet price movements alone cannot explain whether a sudden move comes from aggressive buying, sellers withdrawing their orders, or both. To understand what happens beneath the surface, traders can examine changes in the order book using heatmap analytics in ATAS, observing where visible liquidity builds, shifts, or disappears as price approaches. This adds valuable context to candlestick charts and helps distinguish genuine buying or selling pressure from changes in available liquidity.
Liquidity Is More Than Trading Volume
Four Measures That Tell Different Stories
Liquidity means trading meaningful size without moving price too far. High volume shows activity, not necessarily cheap execution. Four measures tell more:
- Bid-ask spread
The distance between the best quoted buying and selling prices. A wider spread raises the immediate cost of crossing it.
- Displayed depth
The quantity of resting limit orders at or near the best prices. Depth helps estimate how much an order might consume.
- Price impact
How far prices move as an order executes. This connects liquidity to the size of an actual transaction.
- Replenishment
How quickly new orders replace filled or canceled quotes. Fast replenishment can support active trading even when snapshot depth looks thin.
A quiet market can have tight spreads but little depth. A busy session may show shallow snapshots while orders refresh quickly.
Consider two identical buy orders. In one session, sellers replenish the best ask, and the fill barely changes price. In another, visible offers disappear, forcing the same order through several price levels. Traded volume can look similar even though execution costs differ sharply.
Why a Large Order Wall Is Not a Promise
Order books show displayed intentions, not promises. Orders can move or vanish, some interest remains hidden, and venues reveal different slices of liquidity. A bright heatmap band cannot guarantee a reversal.
In digital assets, Bitcoin heatmaps help illustrate where visible orders cluster. But displayed orders matter only if they stay available when price arrives.
The Opening Rush and the Midday Lull
At the Open, Information Meets Orders
The US stock market opens its regular session at 9:30 a.m. Eastern Time. Overnight news and queued orders feed opening price discovery. Stocks use opening auctions; index futures trade earlier but often respond sharply to the cash open.
Early volume and price changes can be intense. Market makers reassess risk, so depth may shift rapidly. Before trusting the opening move, examine:
- Whether the spread narrows after the first burst of activity.
- Whether bid and ask depth holds or retreats as price tests a level.
- Whether aggressive orders keep moving price or meet repeated replenishment.
A strong opening candle can reverse when the initial imbalance fades. Moreover, an opening auction pools stock orders at a clearing price, while futures trade continuously. This difference matters when comparing a stock index with its futures contract during the first minutes.
Midday Can Be Calm and Still Be Fragile
US equity and index futures activity often forms a U-shaped pattern, with lighter turnover between the open and close. Yet quiet prices do not guarantee deep liquidity.
When orders arrive slowly, a moderate trade can move price unexpectedly. Stable quotes, however, may still support smooth fills. Depth and quote refresh matter more than the hour.
Crypto adds a useful contrast. Exchanges trade 24/7. However, there are regional time zones, and guides to same-day crypto trading will take this into account. Your execution will vary depending on major desks being open, market overlaps, and liquidity levels per exchange. There is often a daily cycle to a global market with no official ringing of the bell.
The Closing Window and Unexpected Stress
Why Volume Returns Near the Close
Near the close, traders reduce exposure, hedgers adjust risk, and funds track benchmark prices. US stock auctions match closing orders at one official price, concentrating activity.
Unlike stocks, the index futures market reacts to the closing of the cash market. In addition, volume can increase as the clock approaches four o’clock Eastern time (4:00 p.m.) and around month-end or rebalancing. This may be due to regular inflow/outflow. You must differentiate between one-way flow and bid-ask. It is also important to note that not all futures stop being traded when the cash market closes.
The closing auctions allow orders to be accumulated at a set price. A large closing print therefore reveals little about how much displayed liquidity was available just beforehand. Treat auction volume and order-book depth as different observations.
When News Overrides the Daily Pattern
Inflation reports, policy decisions, and unexpected headlines can disrupt any session. Market makers may reduce quotes as investors rush to trade. Prices move faster when demand rises and liquidity supply retreats.
A 2025 liquidity study by CME Group offers a striking example. On April 7, 2025, E-mini S&P 500 futures volume was more than 99% above its first-quarter daily average, while displayed order-book depth was 68% lower than during the week beginning March 31. Execution quality also worsened. High turnover did not mean cheap execution.
In such conditions, a useful sequence is:
- Note the normal spread, depth, and recent order cancellations.
- Watch whether aggressive trades consume resting orders or whether quotes vanish first.
- Check whether spreads normalize and fresh orders return before judging the new price range.
One large trade cannot reveal intent, and a canceled quote alone does not prove manipulation. Compare price impact at similar order sizes: one tick of movement after a small trade tells a different story from several ticks after a large one. Volatility also changes what counts as unusual.
Reading Liquidity Across the Day
Match the Evidence to the Trading Window
Footprint charts show executed volume by price, a depth display shows current bids and offers, and a heatmap tracks their history. Combined, they help distinguish aggressive flow from changes in resting supply.
| Period | Common pattern | Most useful question |
| Open | Fast repricing and changing quotes | Is depth replenishing after the initial rush? |
| Midday | Lower turnover, sometimes sparse depth | Would a moderate order move several price levels? |
| Close | Benchmark flows and position adjustments | Is the surge two-sided or strongly imbalanced? |
| Stress event | Cancellations, sudden demand, wider impact | Are spreads and fill conditions stabilizing? |
These patterns depend on the instrument, venue, calendar, and data feed. Missing depth data limits any conclusion.
Build a Comparison That Can Be Repeated
Compare one instrument across consistent time windows and order sizes. Record:
- The typical spread and depth at the open, midday, and close.
- How often quoted orders disappear before price reaches them.
- Whether trades execute across several price levels or meet replenished orders.
- How those readings change on announcement days versus ordinary sessions.
Using Market Replay and looking at past Order Flow, you can see what is happening. Although there is no indication of what will happen using the clock, you can get a good understanding of how much demand the market can absorb.